
Market Intelligence
Quickly assess the economic and housing fundamentals of a site’s location to understand the opportunity at a glance
What This Section Does
1
Market Intelligence provides a data-backed snapshot of a site’s surroundings using U.S. Core-Based Statistical Areas (CBSAs) and County information. This helps answer the first question you should be asking:
“Is this market worth spending time on?”
It shows you:
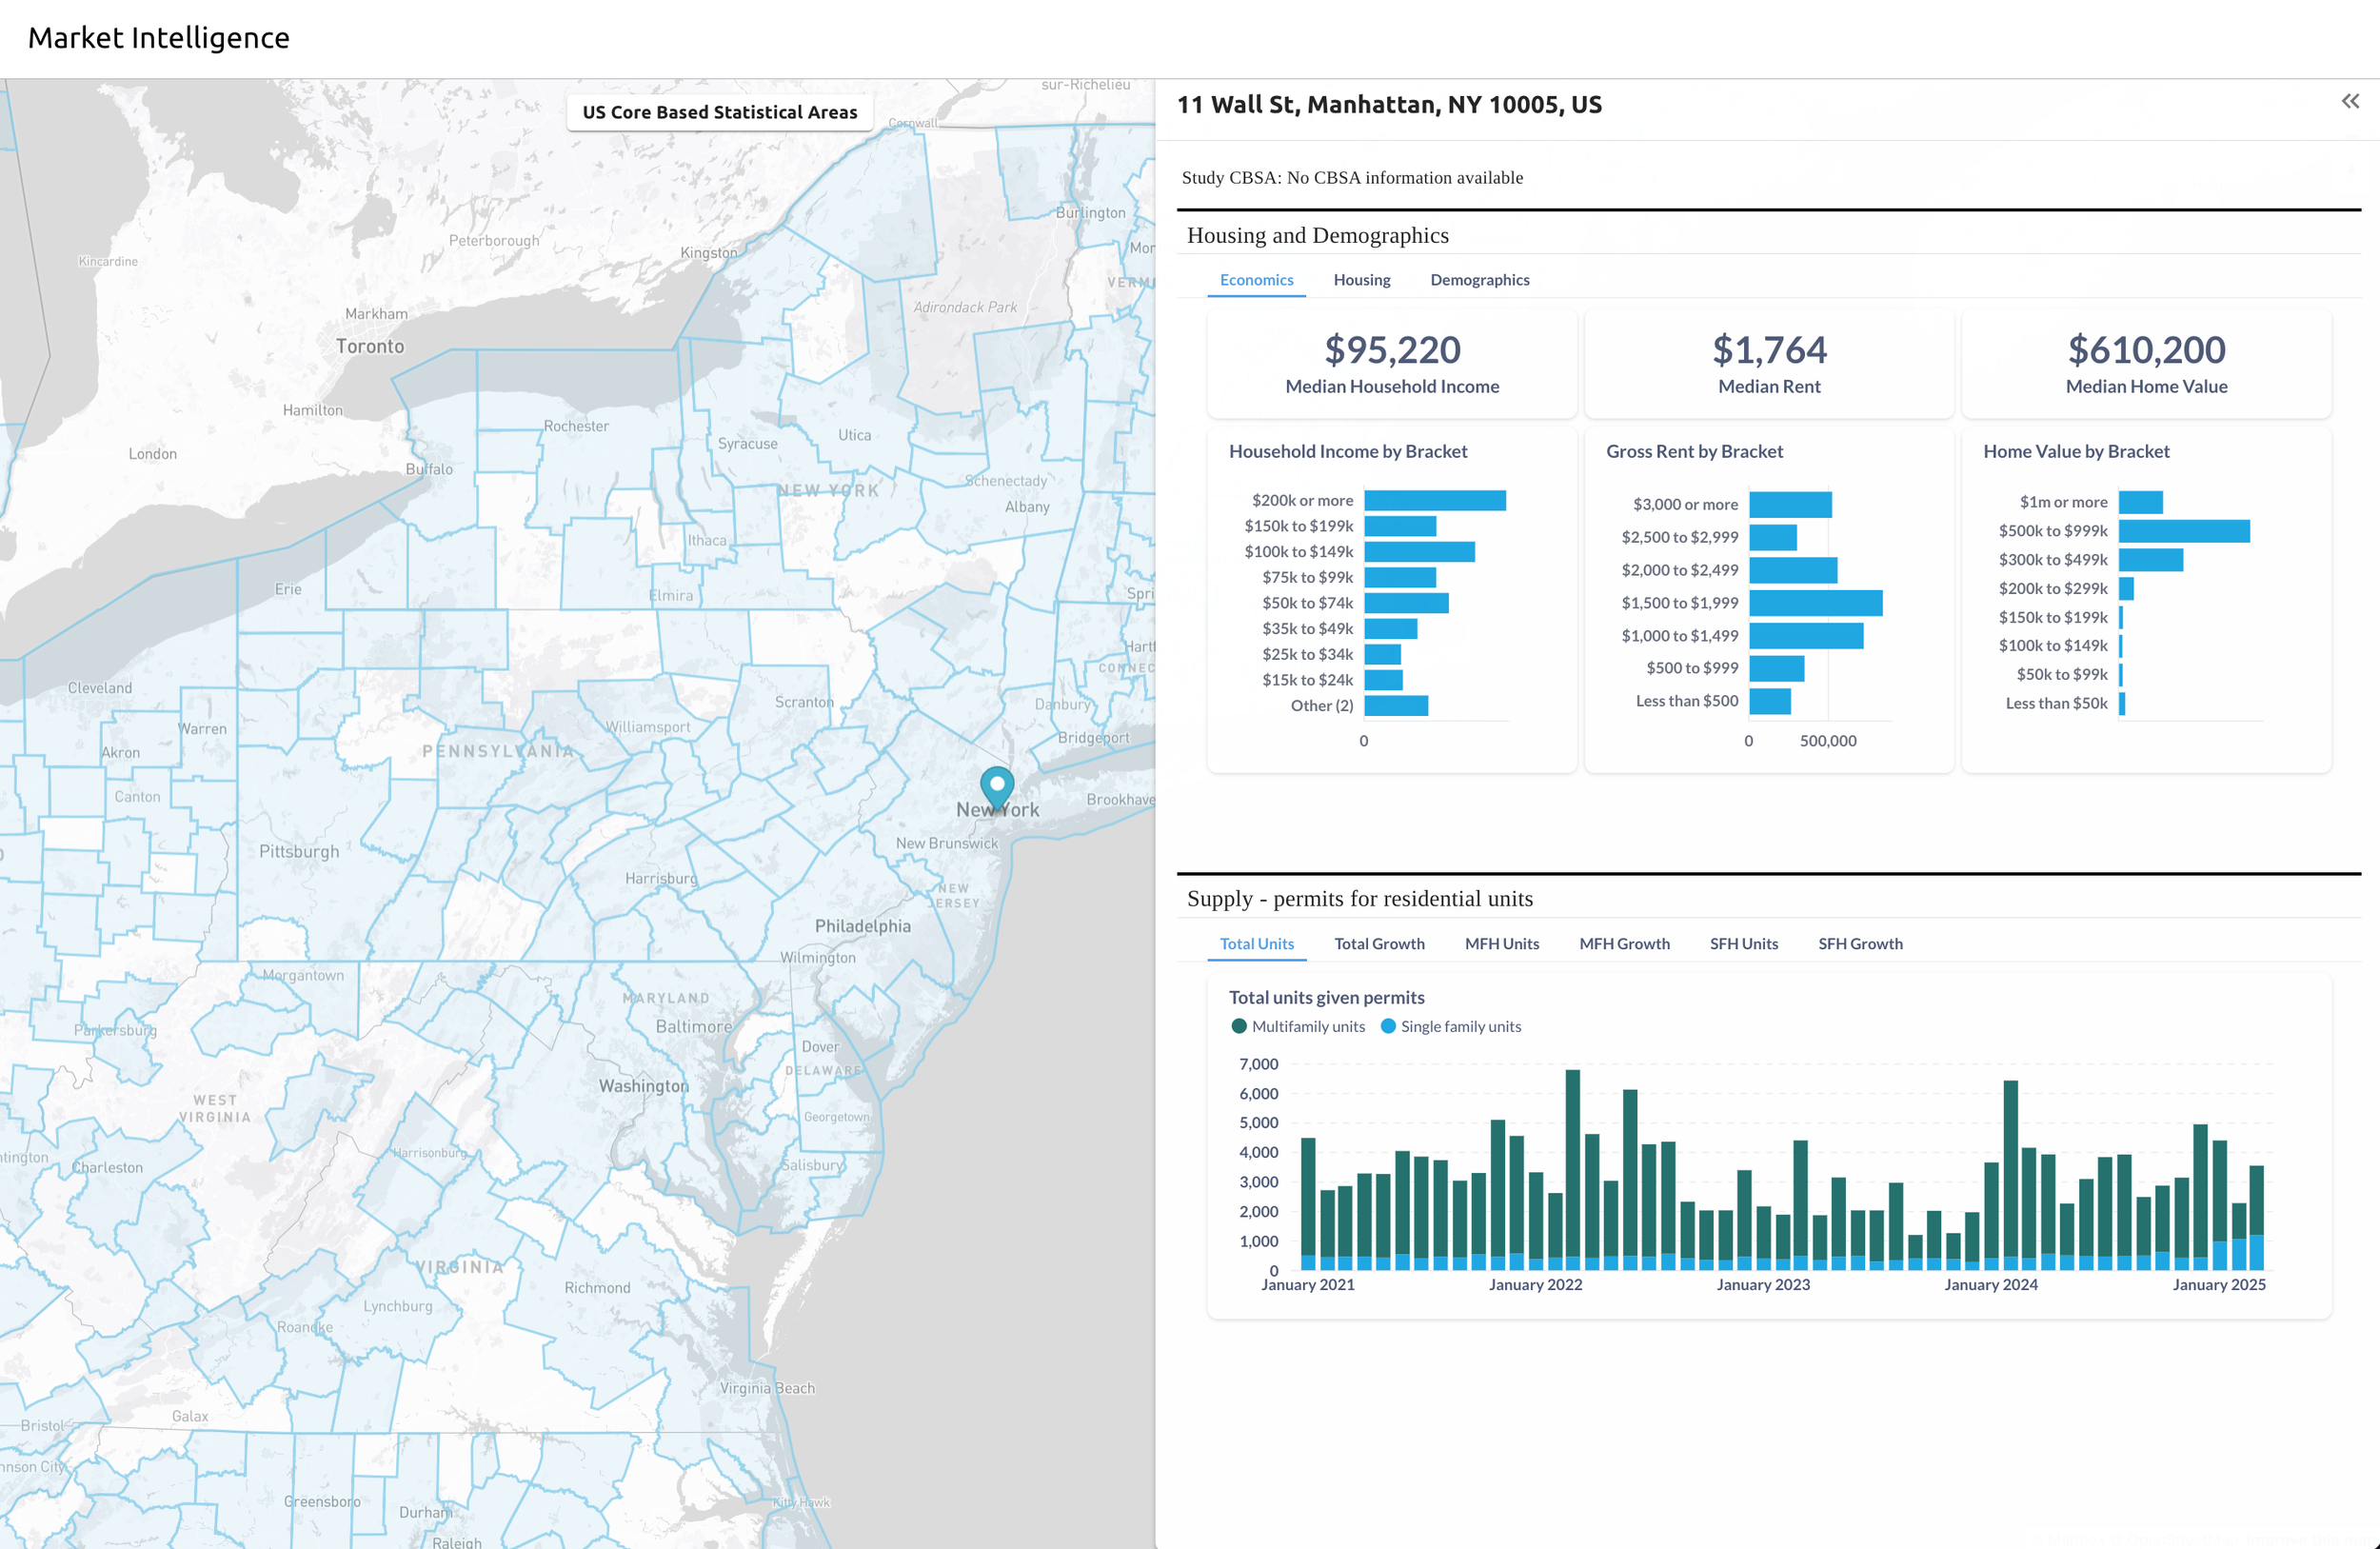
$68,250
Median Household Income
+3.2%
$1,450
Median Rent
+5.8%
$285,000
Median Home Value
+8.1%
Median Rent: Current rental market baseline
Median Household Income: Economic capacity of the area
Median Home Value: Overall property value context
Housing Supply Trends: Development activity and growth patterns
All broken down by income and housing value brackets. This is the fastest way to contextualize a site before diving into deeper comps or zoning layers.
How to Use It
2
Summary Cards Preview
What You’re Looking For
3
Use Market Intelligence to:
Validate Fundamentals
Ensure that the economic fundamentals match your investment thesis. Look for income levels that support your target rent ranges.
Housing Stock Trends
Understand whether the local housing stock is growing or constrained. Supply trends directly impact pricing power.
Market Opportunities
Spot emerging markets over overbuilt ones. Look for mismatches between supply and demographic trends
Income Misalignment
Target rents exceed local capacity
What Comes Next?
4
Using This Data Effectively:
1. Validate your rent assumptions against income levels
2. Assess long-term demand sustainability
3. Identify emerging vs. mature markets
4. Understand competitive positioning
5. Forecast absorption and leasing velocity
Context for Decision Making:
Use this data to understand the broader market story beyond just comparable properties. Strong demographics can justify premium pricing, while weak indicators might suggest conservative approaches or different target markets.
1
2
3
4
Navigation to Market Intelligence
1
In the left-hand menu, click “Market Intelligence” under your site’s name.
3
Review the Summary Cards
At the top right, you'll see three primary stats: Household Income, Rent, and Home Values. These give you a quick read on the area's economic profile.
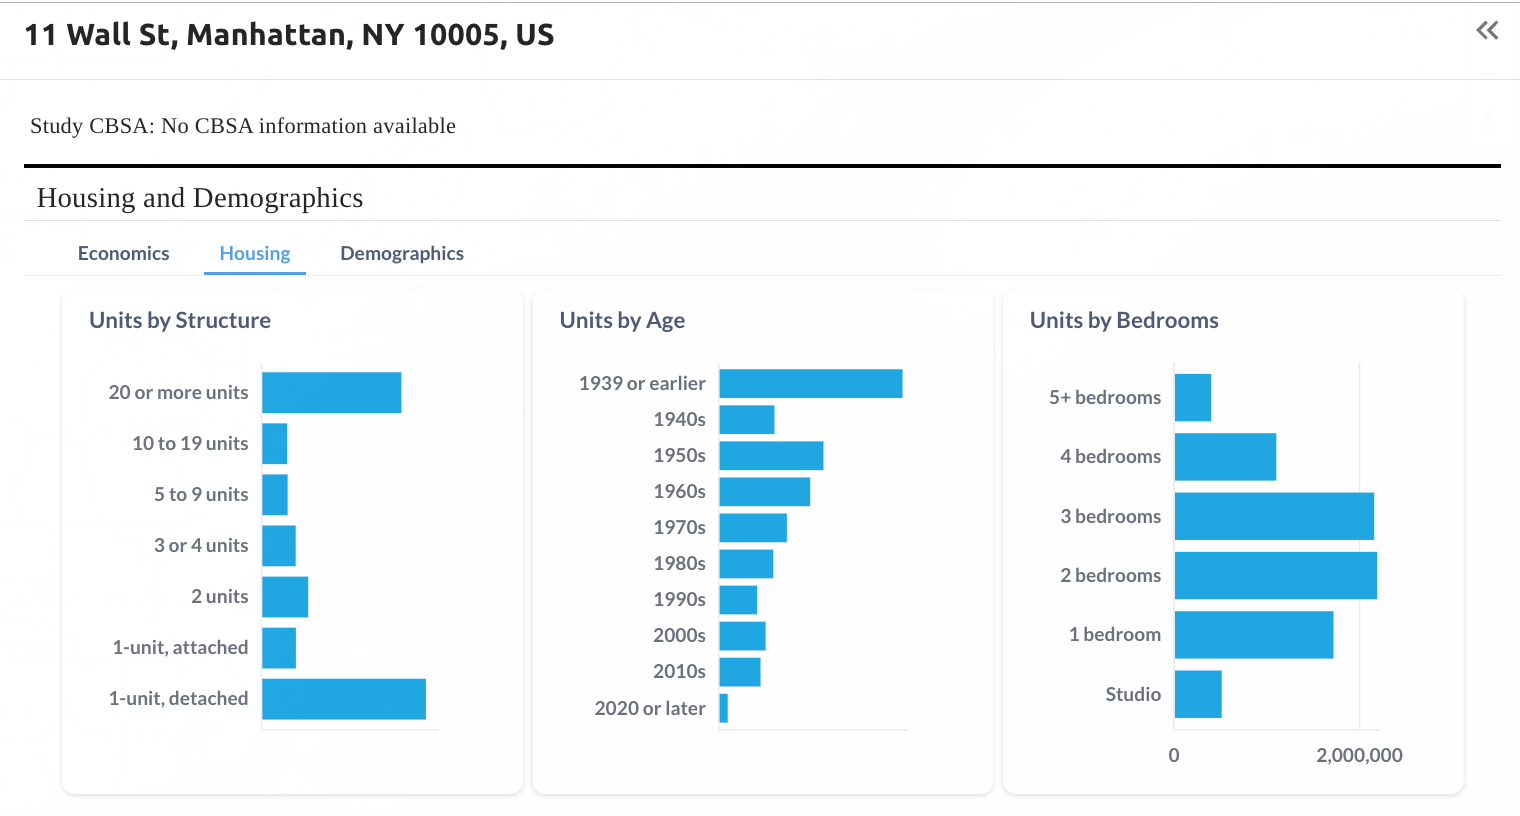
Explore the Bracket Breakdowns
4
Click the tabs above the bar charts (Economics, Housing, Demographics) to get a deeper view of rent brackets, income ranges, and housing cost distribution.
Population Growth Analysis
• Low burden (<25%): Room for rent growth, undervalued market
• Moderate burden (25-35%): Balanced market conditions
• High burden (>35%): Affordability constraints, pricing pressure risk
• Trends: Increasing burden may indicate market maturity
• Job growth: Positive growth supports housing demand
• Employer diversity: Multiple major employers reduce risk
• Industry mix: Technology and healthcare typically support higher rents
• Proximity factors: Distance to major employment centers affects desirability
Market intelligence provides crucial demographic and economic context for your investment decisions. Here's how to read and apply the key metrics:
• Positive growth (2%+ annually): Strong demand indicator, good for rental properties
• Stable growth (0-2%): Mature market, focus on replacement demand
• Negative growth: May indicate declining demand, investigate causes
• Compare: Always compare local growth to regional and national averages
• Time horizon: Look at 3-5 year trends rather than single-year changes
Key Market Signals to Watch:
Strong Income-to-Rent Ratios
Median income supports 3-4x rent multiples
Constrained Supply
Low Permit activity with strong demographics
Oversupply Indicators
High permit activity exceeding population growth
This gives you the baseline context before jumping into comps or parcel-level data
Once you’ve reviewed the market fundamentals:
1
Move on to Rent Comps
Median Income Interpretation
• Income levels: Shows market purchasing power for rent pricing
• Growth trends: Rising incomes support rent growth potential
• Housing cost ratios: Aim for rent that's 25-30% of median income
• Income diversity: Multiple income sources indicate market stability
Housing Cost Burden Analysis
Employment Data Application
Understand what specific units are renting for in the area
Exploring Zoning and Site Capacity
2
Determine what you can build and optimal development scenarios
Choosing your Dataset
2
By zooming in and out you can move between county and metro area. Once zoomed out/in, click on the new dataset and it will update the information in the project browser.