
The Rent Comp module helps you analyze competitive rental properties to set optimal pricing and understand market dynamics. Learn how to read the data, interpret key metrics, and use insights to make informed pricing decisions for your development.
Rent Comp Analysis
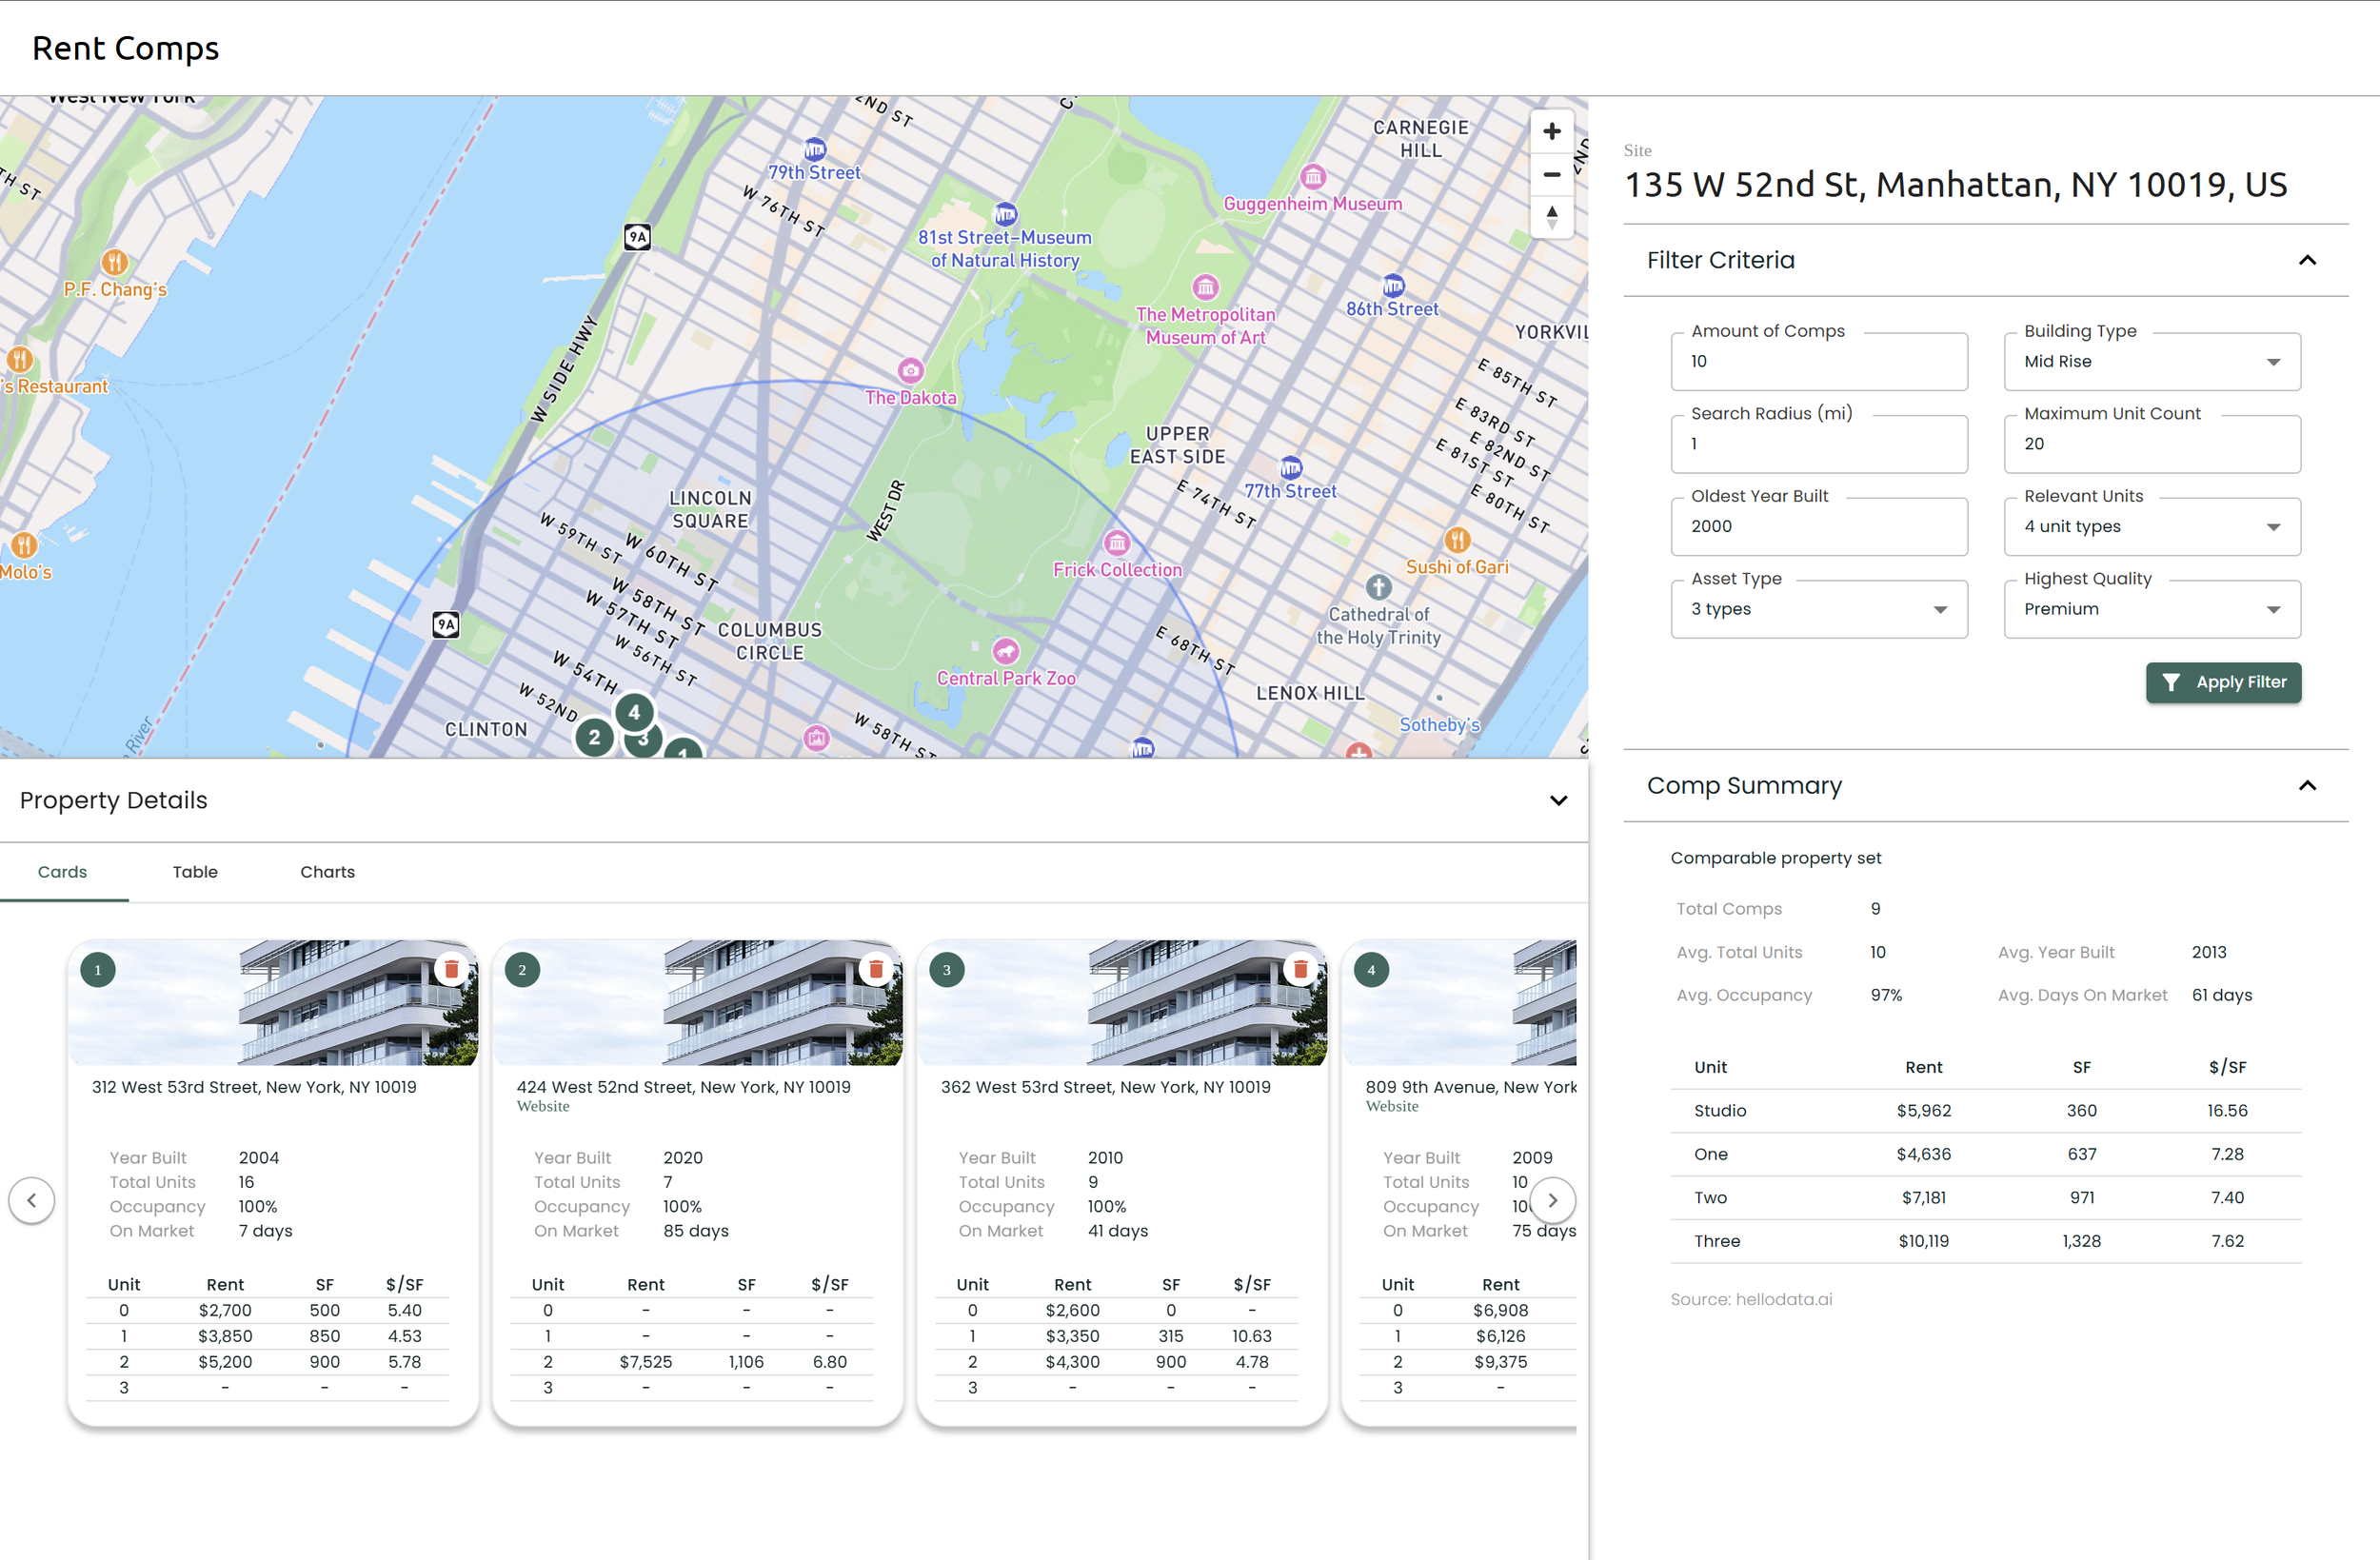
Reading Your Comp Summary
2
Your rent comp analysis begins with a comprehensive summary of key market metrics that provide immediate insights into the rental landscape around your property.
Average Rent: The middle value of all comparable properties
Average $/SF: Mean price per square foot across all comps
Property Count: Number of comparable properties analyzed
Search Radius: Geographic area used to find comparables

Understanding the Views
1
You can view your rent comps data in two different formats, each optimized for different analysis needs. To view these formats click on the comparable properties ribbon at the bottom of the screen to expand it.
Card View - Visual Overview
1
The card view presents each comparable property as an individual card with key details at a glance, perfect for quick visual comparison and initial screening.
2
Table View - Detailed Analysis
The table view displays all comparables in a sortable, filterable format that's ideal for detailed analysis and data comparison. To sort and filter select the 3 dots on any column to sort and filter by that column
Key Metrics Explained
3
Understanding these core metrics will help you make informed pricing decisions and evaluate market opportunities for your development.
Price per Square Foot ($/SF)
The standard measure for comparing rental rates across different property sizes. Calculated by dividing monthly rent by total square footage.
How to use this:
Use this to benchmark your property against similar units and set competitive pricing.
Occupancy Rate
Percentage of units currently occupied, indicating demand and market health in the area.
How to use this:
Higher occupancy rates suggest strong demand and market stability for your property type.
Days on Market
Average time properties spend on the market before being rented, indicating market velocity and tenant demand.
How to use this:
Lower days on market indicates faster absorption and stronger rental demand.
Using the Data Effectively
4
Once you’ve reviewed the market fundamentals:
1
Review summary metrics
Start by understanding the overall market range, median pricing, and property count to get a baseline understanding of the rental market in your area.
2
Filter by property type
Use filters to focus on properties that match your development plans. Filter by bedroom count, property type, and building age to find the most relevant comparables.
3
Adjust the search radius
Change the search radius to see properties closest to your site.
Recommended Radius Guidelines:
• 0.25-0.5 miles: Best for dense urban areas with consistent housing stock
• 0.5-1 mile: Ideal for suburban markets and most analyses
• 1-2+ miles: Necessary for rural areas or markets with limited rental inventory
Radius Strategy Tips:
• Start with 0.5 miles and expand if you need more data points
• Consider neighborhood boundaries and natural barriers
• Exclude different submarkets (e.g., across major highways)
• Balance quantity of comps with relevance and similarity
Larger radii provide more data points but may include less relevant comparables. The optimal radius depends on your market density and the uniqueness of your property.
Once you have found an optimal search radius, you can sort properties by distance from your site to see the most relevant properties for pricing comparisons.
4
Analyze outliers
Investigate properties with significantly higher or lower rents to understand what features command premium pricing or indicate potential value opportunities.
5
Set target rent range
Based on your analysis, establish a target rent range that considers your property's unique features, location advantages, and competitive positioning in the market.
The chart view displays all the various unity types of the comps organized by rent/SF
3
Chart View - Detailed Analysis